How to determine canopy area in QGIS
We will determine canopy area with the Zonal Statistics function, which allows us to download data for each cell in our plot grid from our raster files (e.g., maps). All we will need is a plot grid and a classification layer distinguishing plants from soil, which were generated in previous lessons.
- At top left, click “View” →
“Panels” and make sure “Processing Toolbox” is checked.
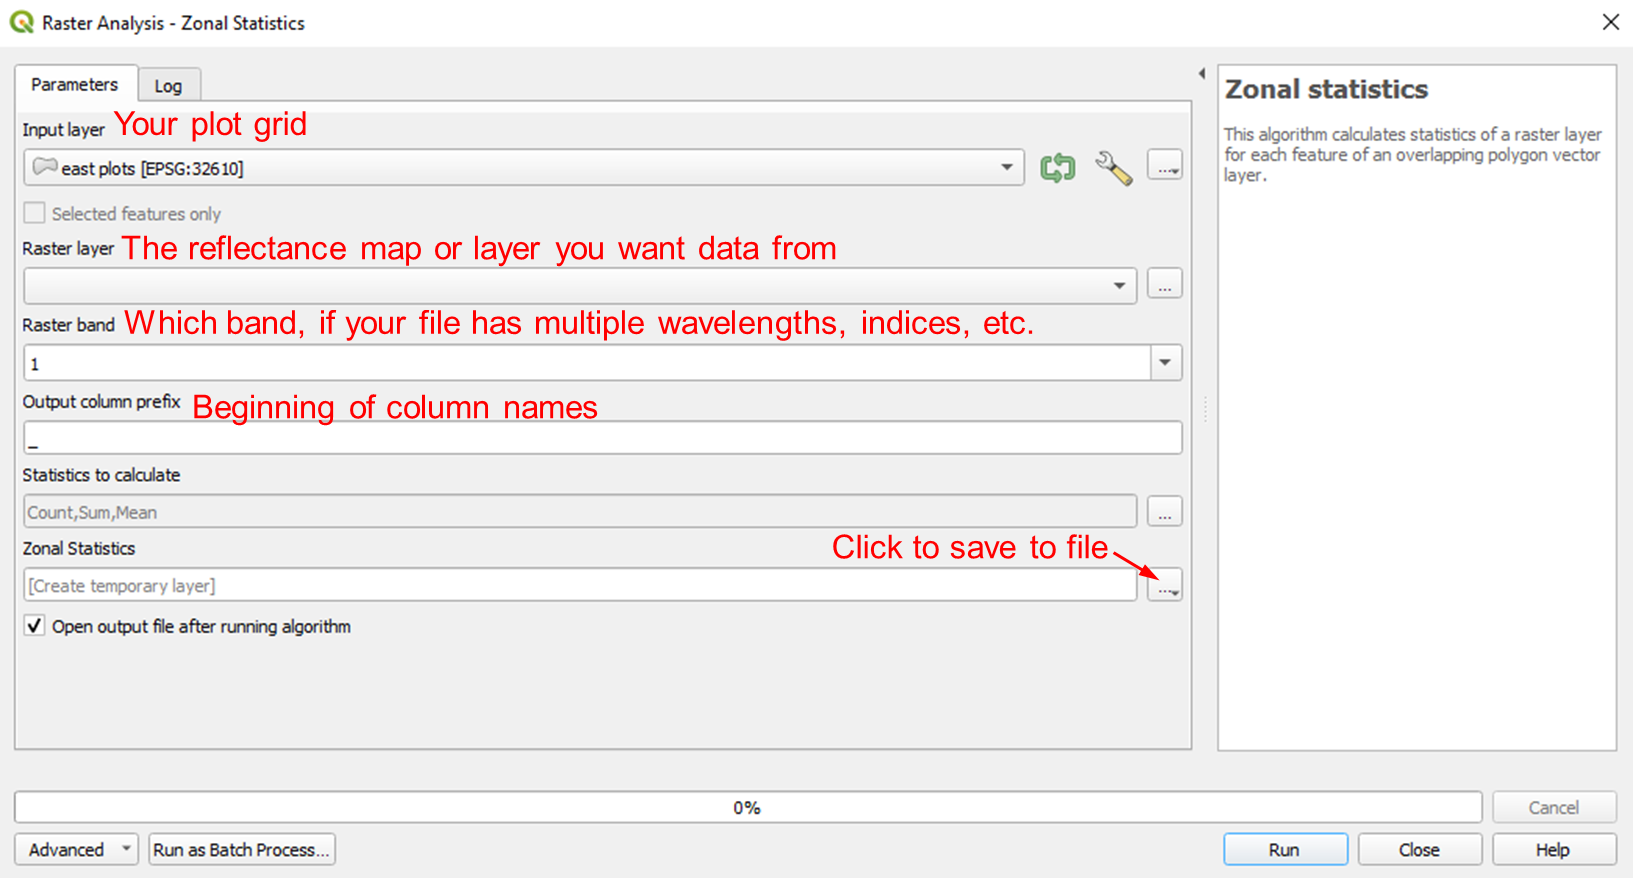
- In the Processing Toolbox, search “Zonal Statistics” and click
on it. A new window will appear.
- Below “Raster layer” select the raster layer with
the threshold layer (from the previous lesson) that masks soil but keeps non-soil pixels.
- Below “Polygon layer containing the zones”, select your shapefile layer.
- Below “output column prefix”, make a very short header for all your columns, eg. “area_”
- Below “Statistics to calculate, check whichever boxes you want data for. For simple canopy cover, just check the box for “Mean”, which will ultimately output the “mean” proportion of each cell (plot) in the grid that is plant canopy:
- Click “Run.”
- In the Layers Panel at lower left, right click the polygon layer that was just generated. Select “Open attribute table”.
- If you have any questions about which cells were which in your grid, you can click the row header on the far left to select some, and see those cells in your grid get selected.
- Use Ctrl+A and Ctrl+C to copy the whole attribute table.
- Open a new Microsoft Excel spreadsheet.
- Use Ctrl+V to paste the spreadsheet into your document. These canopy area proportions will tell you what proportion of each cell was plants. In a new column, multiply by the area of each cell in your grid (what you entered into the Create Grid function earlier) to calculate total area.
- Sort your data according The default is for the shapefile cells to be ordered starting at the top left and moving down to the bottom, then shifting one column to the right and moving down, and continuing. Usually, we number our field plots in a serpentine way. I would recommend having one document as a “sorting key”, with one column specifying shapefile grid cell ID and one column specifying the normal field plot ID. For me, this is basically just another column in my fieldbook called something like “QGIS_plot_ID”. You can make this key once, then drop it in for each flight date and immediately sort your files quickly.
- Check a few plots. Which had the highest canopy cover? Which had the lowest? Check your QGIS project. Does this fit with what you see on the QGIS map canvas? You can select cells using the Select Features tool when the grid is selected in the layers panel. Then open the attribute table and check those cells. Or vise versa. This will help confirm that there were no errors made and that you can trust your awesome new data!
