Calculating vegetation indices
Vegetation indices are simple equations that compare reflectances at different light wavelengths. One of the most common vegetation indices, the Normalized Difference Vegetation Index (NDVI), can be calculated directly in Pix4D, and the next protocol will continue with that data. If you are working with this data, you can skip ahead to the next lesson. If want to calculate other vegetation indices, read on.
There are many vegetation indices, and they are used to understand plant health, stress responses, and to separate vegetation from soil, for example.
Imagine a healthy plant. It’s dark green, right? That’s because it is reflecting very little blue or red light, but some green. An unhealthy plant might be yellow, and it would have more of those other wavelengths reflected. Therefore, making a simple equation like this might tell you something about plant health:
Green reflectance
_______________________
Red + Green +
Blue reflectance
For a healthy plant, nearly all the light reflected is green, so it would have a high value.
An unhealthy plant is reflecting those other wavelengths, so it would have a lower value. We can do
calculations like this in QGIS using the “Raster Calculator”. We could make a slightly more
robust version of the equation above to study canopy health using RGB imagery:
Excess Green (ExG):
The equation for Excess Green is:
2 * (Green / (Red + Green + Blue)) – (Red / (Red + Green + Blue)) – (Blue / (Red + Green + Blue))
VARI:
The equation for VARI is:
(Green -
Red) / (Green + Red - Blue)
For this
exercise, we will continue using ExG.
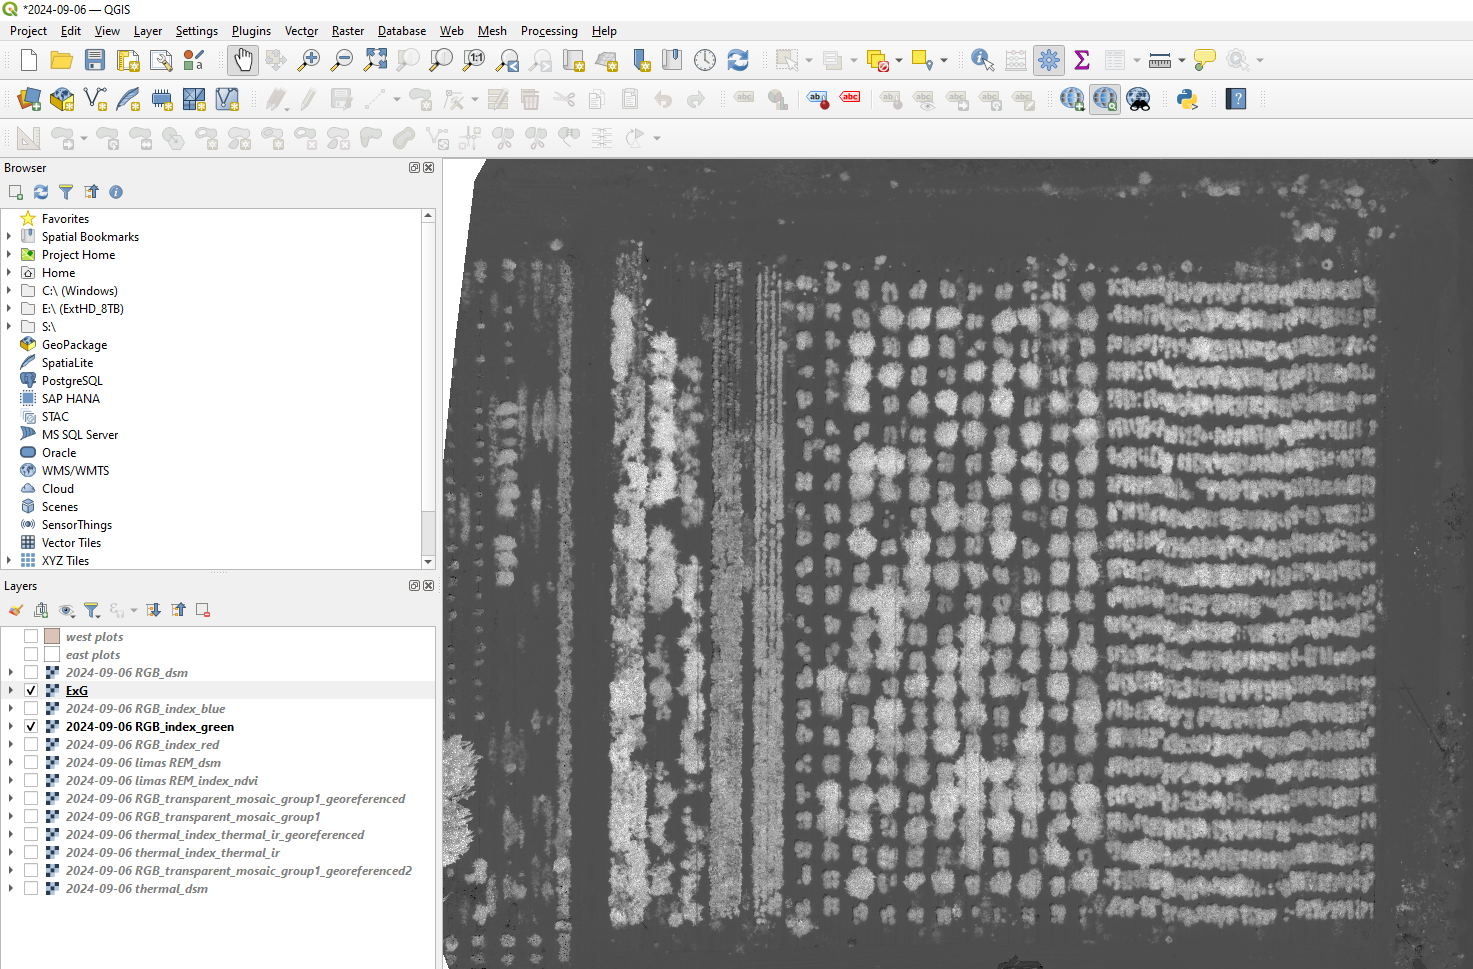
- Load some reflectance maps into your project. If
importing from Pix4D, it is best to do this from the 4_index folder, rather than
3_dsm_mosaic.
- Go to Raster → Raster calculator.
- To the right of “Output Layer”, click the three dots and choose where to save your outputs.
- Click on the layers you want to use to calculate. Add symbols by typing them in the box at bottom with your keyboard, or clicking the provided keys with your mouse
Bonus note: If you are using RGB data, index maps are certainly recommended. If you have no choice but to use the RGB orthomosaics, the data is stored in separate bands of a single file accordingly, and you may have to type this in manually:
Red = IMAGE_NAME@1
Green = IMAGE_NAME@2
Blue = IMAGE_NAME@3
- To calculate ExG, your expression should look something like this:
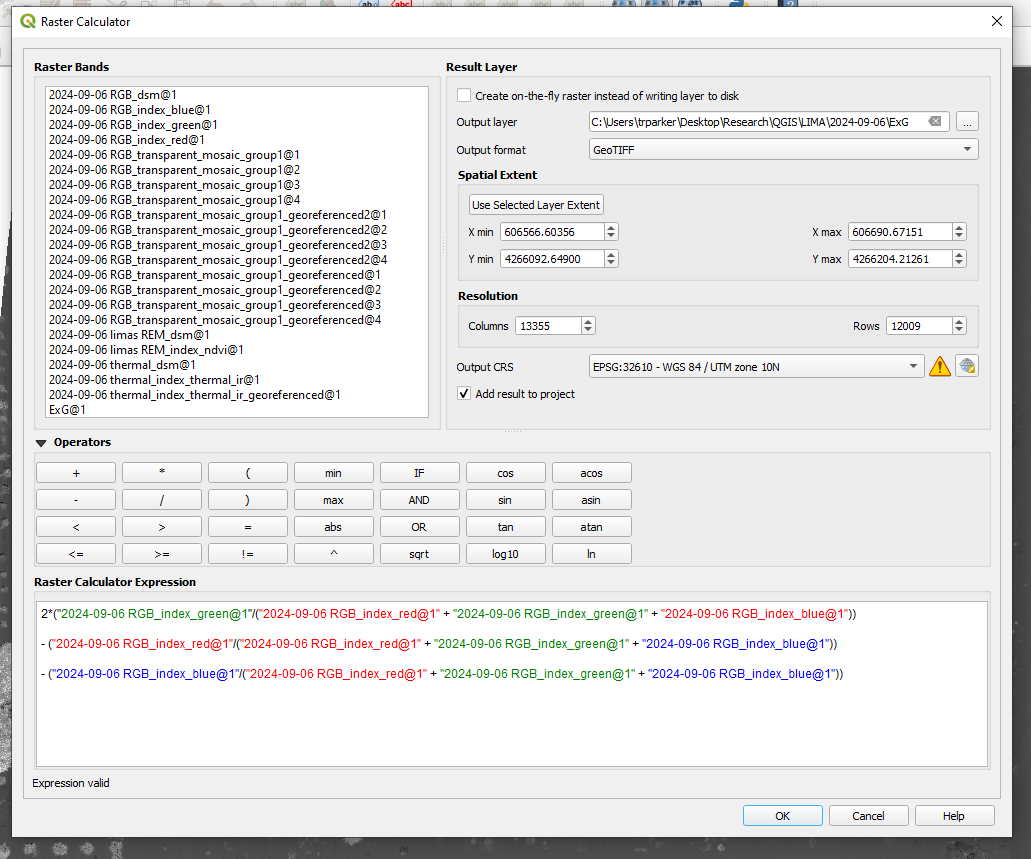
2*("2024-09-06 RGB_index_green@1"/("2024-09-06 RGB_index_red@1" + "2024-09-06 RGB_index_green@1" + "2024-09-06 RGB_index_blue@1"))
- ("2024-09-06 RGB_index_red@1"/("2024-09-06 RGB_index_red@1" + "2024-09-06 RGB_index_green@1" + "2024-09-06 RGB_index_blue@1"))
- ("2024-09-06 RGB_index_blue@1"/("2024-09-06 RGB_index_red@1" + "2024-09-06 RGB_index_green@1" + "2024-09-06 RGB_index_blue@1"))
- Click OK.
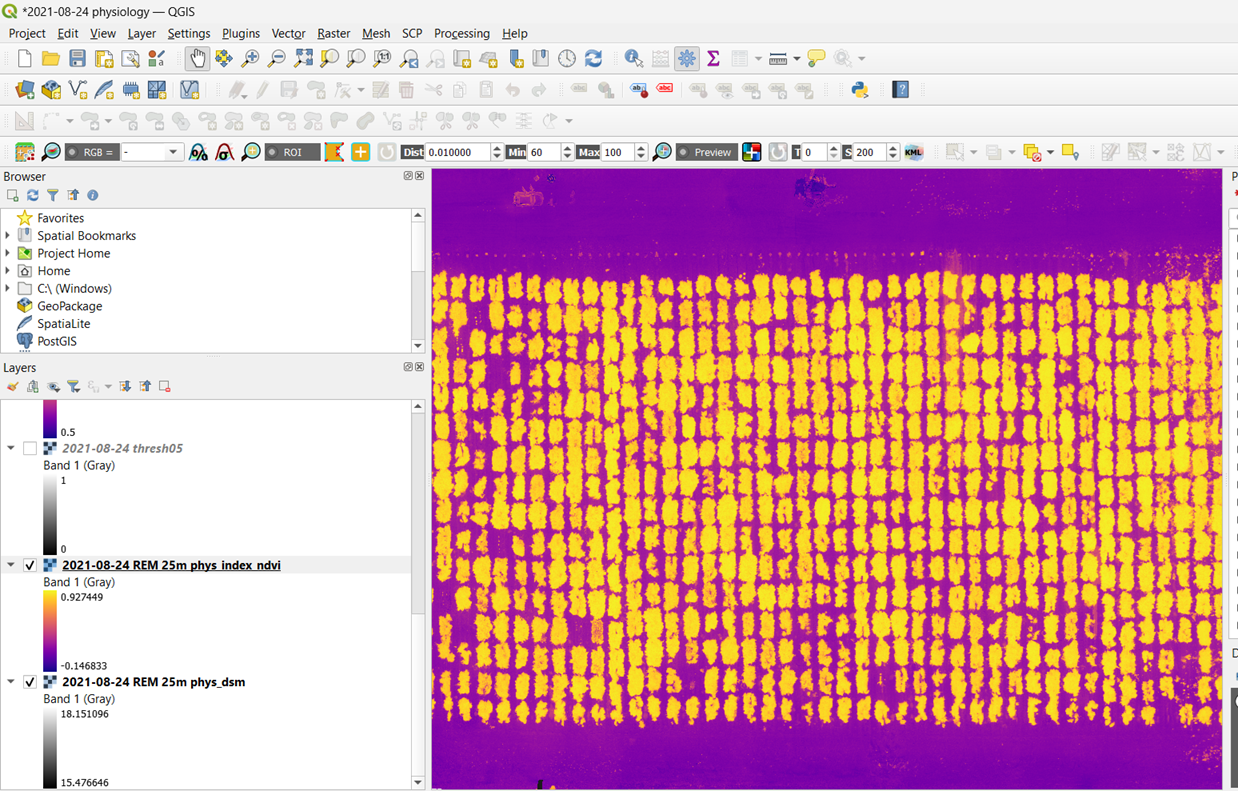
- After a few seconds, the new band will appear in your layers panel and interface. It should look something like this:
8. Keep in mind that this is a flexible process. There are many vegetation indices. Consider calculating a few and use what works best for you!
Optional: Making your vegetation index map look more awesome
- Right click name of project in layers panel at bottom left.
- Click “Properties”.
- Click “Symbology” (at left).
- Change render type to “Singleband pseudocolor.”
- To the far right of “Color Ramp”, click the drop-down arrow. You may want to then click “All color ramps”. Change color to “RdYGn”, “Inferno”, or whatever you prefer.
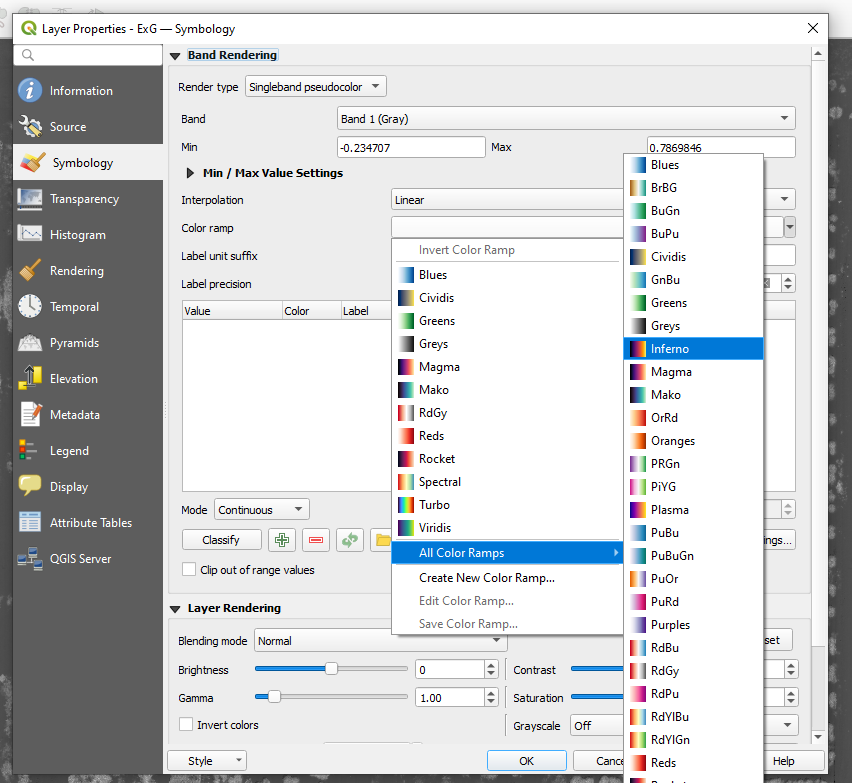
- Change “Mode” to “Equal interval” and “Classes” to “10” or more.
- Click “OK.”
- See what you think. Consider going back into the Symbology and adjusting the Min and Max values. This is just an artistic representation. Your actual values are not affected. Do what looks good.