A brief introduction to QGIS
How will we get numbers from images? QGIS!
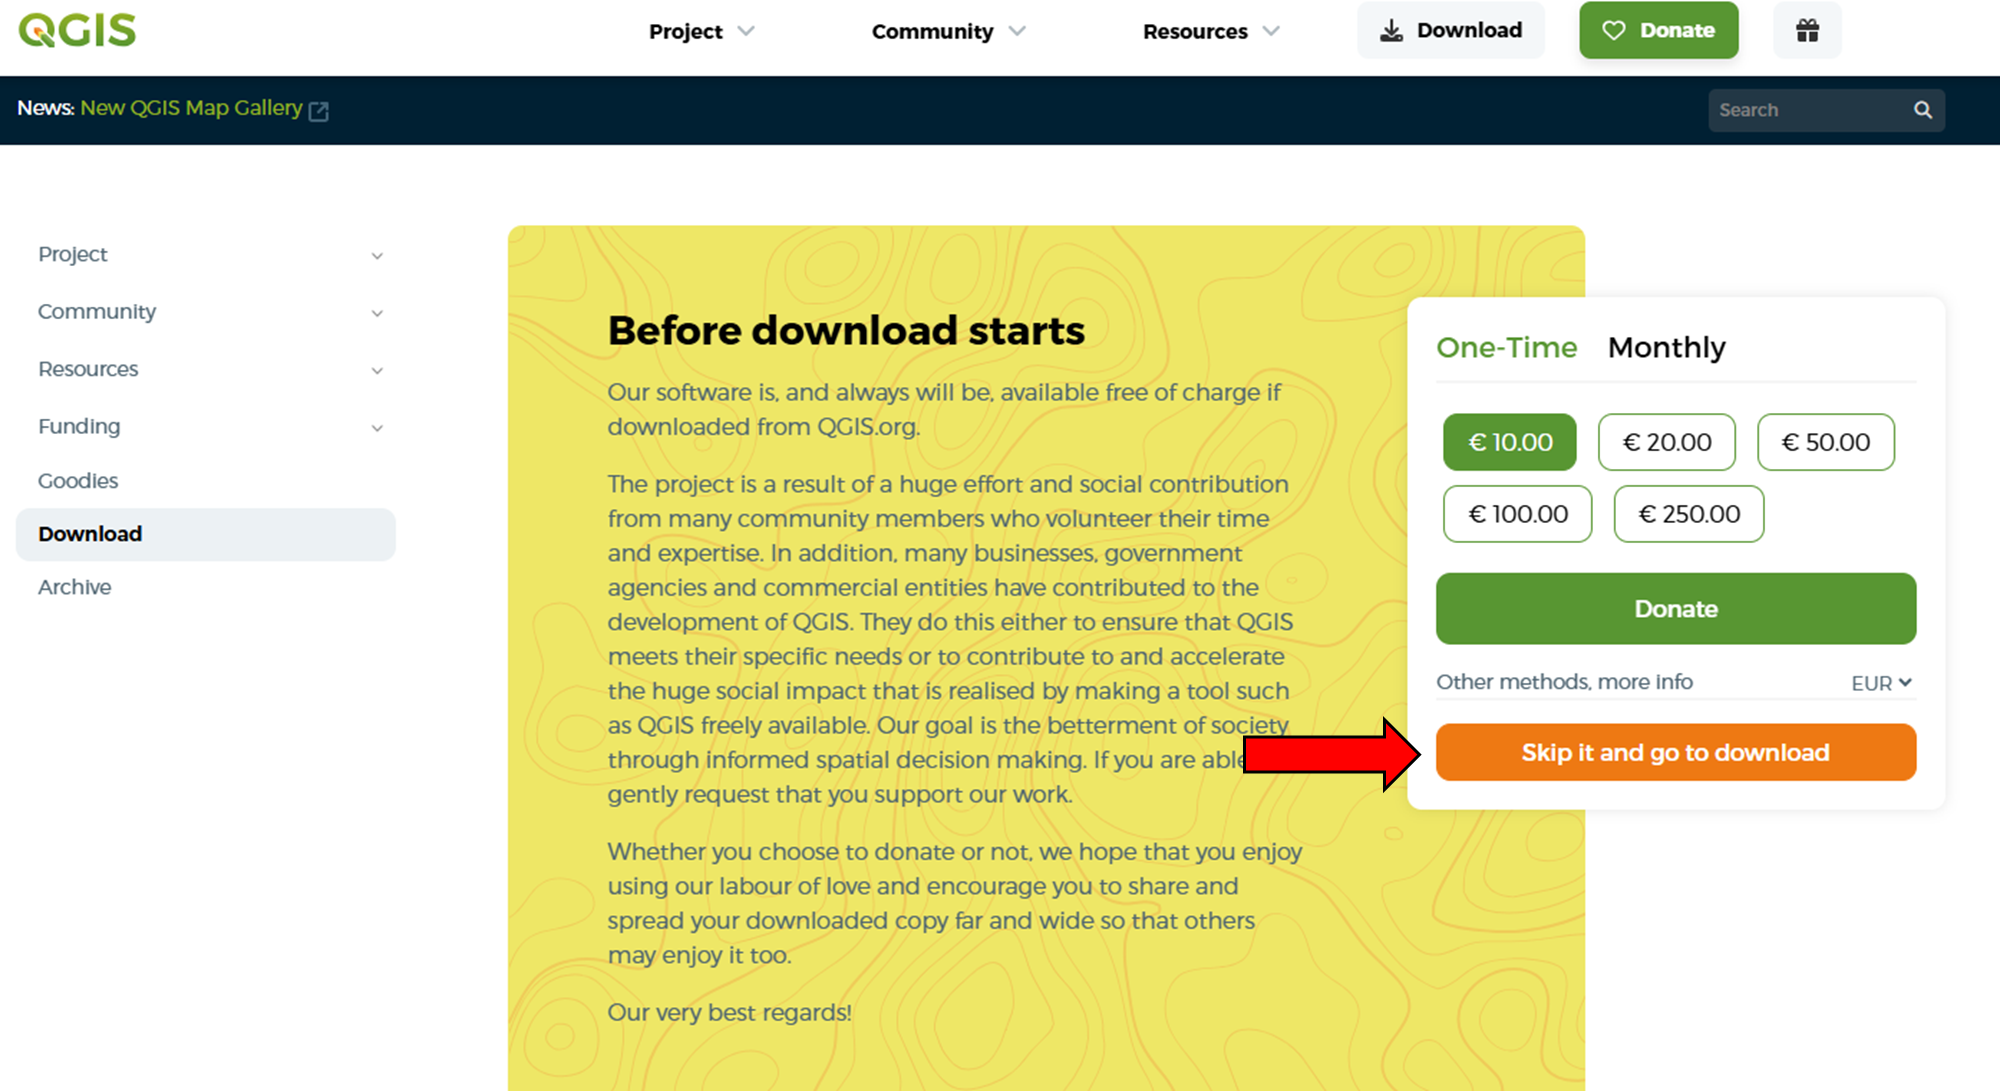
1. First, let’s install QGIS. Go to https://qgis.org/download/
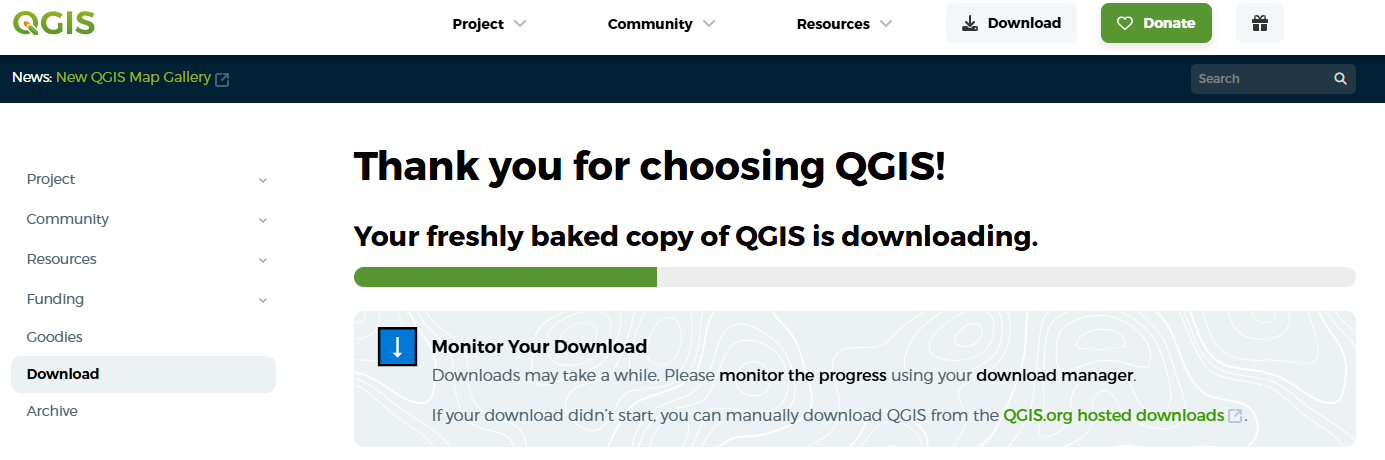
2. Click “Skip it and go to download”, or contribute to the QGIS project
3. Download and install the QGIS Standalone Installer Version 3.34 or later. It may be helpful to download the stable long-term release rather than the other versions.
4. Open the Installer and click “Next” through the steps, then “Install”
5. Open QGIS.
6. Project → New.
7. File → Save As (then save)
8. Select a tif image or other file of interest and drag them into the blank area in the middle of the project (the “canvas”), where they can be seen
9. The Layers Panel: Files you have added will show up in the Layers Panel at the bottom left. Uncheck the box next to them to hide them, and use the small arrow to the left of each to provide more or less information about each. Layers shown at the top of the list will cover the other layers in the main part of the screen, “hiding” the lower layers. If you ever zoom too far out, you can right click the layer in the Layers Panel and click “Zoom to Layer” to find it again.
10. Raster vs. Vector graphics: These are good terms to know. Raster graphics are pixel-based. If you zoom in on them, you will see they become pixelated. Many of the files we work with are like this: reflectance maps, digital surface models, etc. Vector graphics are mathematically defined. There is some kind of mathematically defined line, curve, or points that define them, and you can zoom in forever without them becoming pixelated. Fonts are a great example. Our plot shapefile grids will be vector files. I will throw these terms around a bit, but I try to avoid them because they can be kind of jargon.
11. Try using the Select tool to check individual results, clicking on the files in the canvas. It will return data about whichever layer is selected (in blue in the Layers Panel). Those results are displayed in the “Identify Results” area at bottom right. You may need to drag that panel wider to see them. This is a useful tool for checking specific points in your field. If you had 1 million years, you could probably just click around all your files getting data with this tool. But most of us probably won’t last that long, so we can find more efficient ways to get that data. And that is what these lessons are all about!

12. Combining the following three key tools is a basis for doing all kinds of incredibly powerful things in QGIS. Each can be accessed by searching the Processing Toolbox (View → Panels → Processing Toolbox). We will continue to work with these throughout upcoming lessons, but I wanted to introduce them briefly here. These functions are:
- Create Grid: Sets up a polygon grid that specifies plots or other areas of interest.
- Raster calculator: This allows you to create mathematical comparisons between your layers, such as between heights, vegetation indices, temperature, and much more.
- Zonal statistics: This allows you to extract data for each cell in your grid from your maps and
models of interest, and stores it in an attribute table, from which it can be copied and pasted into
Excel.
13. Alright, now that you have a little introduction to these, let’s explore them in more detail in the next lessons!