Calculating vegetation indices with soil masked
You can use your shapefile grid to calculate average NDVI values from your raw
NDVI map. The problem with this, however, is that much of the plot area may be soil, water, or other
material. In these cases, your average values will largely be based on canopy cover, not canopy
health.
How do we determine the health of plants, while ignoring soil or water?
In a previous lesson, we made layer that distinguishes plants from non-plant surfaces in your maps. Now, we will use it to remove the non-plant area for each plot. This is called masking.
- Open the Raster Calculator with Raster → Raster
Calculator
- Click the three dots to the right of “Output Layer”, choose a location and name for your outputs.
- To make an expression, click on the raster bands you are interested in and type in the following equation, but with your file names:
“NDVI_LAYER_NAME” / “THRESHOLD_LAYER_NAME”
The two files above were described in previous sections on vegetation indices and classifying/masking soil from plants The window should look something like this:
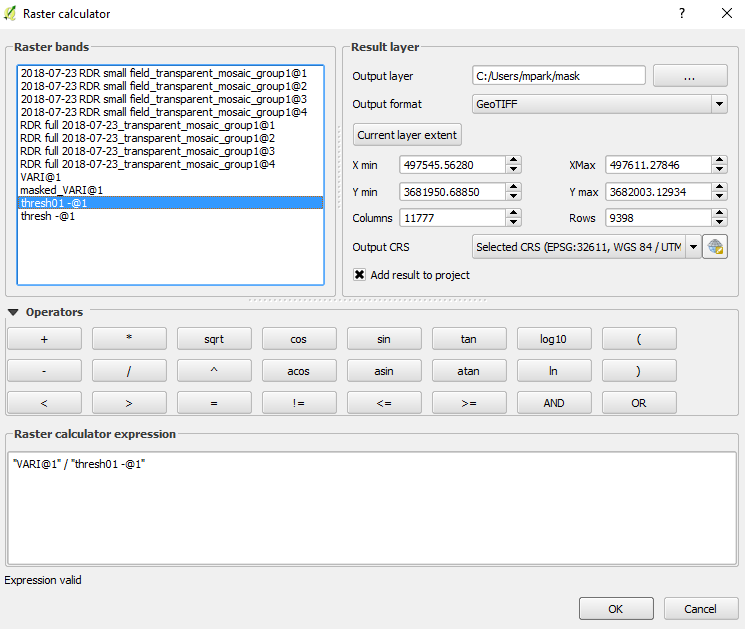
- Click OK.
- In a few seconds, a new layer will appear in your layer panel. It will only have color where the values are above your threshold, while soil will be transparent (This is because the non-plants were stored as “0” values in our threshold file, while plants were stored as “1”. Dividing by 0 gives an NA, and the computer ignores the value). Use the zonal statistics plugin to extract plot statistics, as described in the previous lesson. These will be summary statistics of your plant canopies, without soil!