Introduction to drone use in plant science
Welcome! This site is intended to give step-by-step methods on the drone data
processing pipeline… from planning missions, through getting data in a spreadsheet. Use whichever
methods are helpful for you! And have fun!
If these methods are useful to you, we would be extremely
grateful for a cite!
Parker, T.A., Celebioglu, B., Watson, M, and Gepts, P. “Drone methods and educational resources for plant science and agriculture”. In review.
The big idea: We will walk through all of this in more detail throughout the site!
- Generate research questions, plan experiment, choose appropriate cameras and aircraft
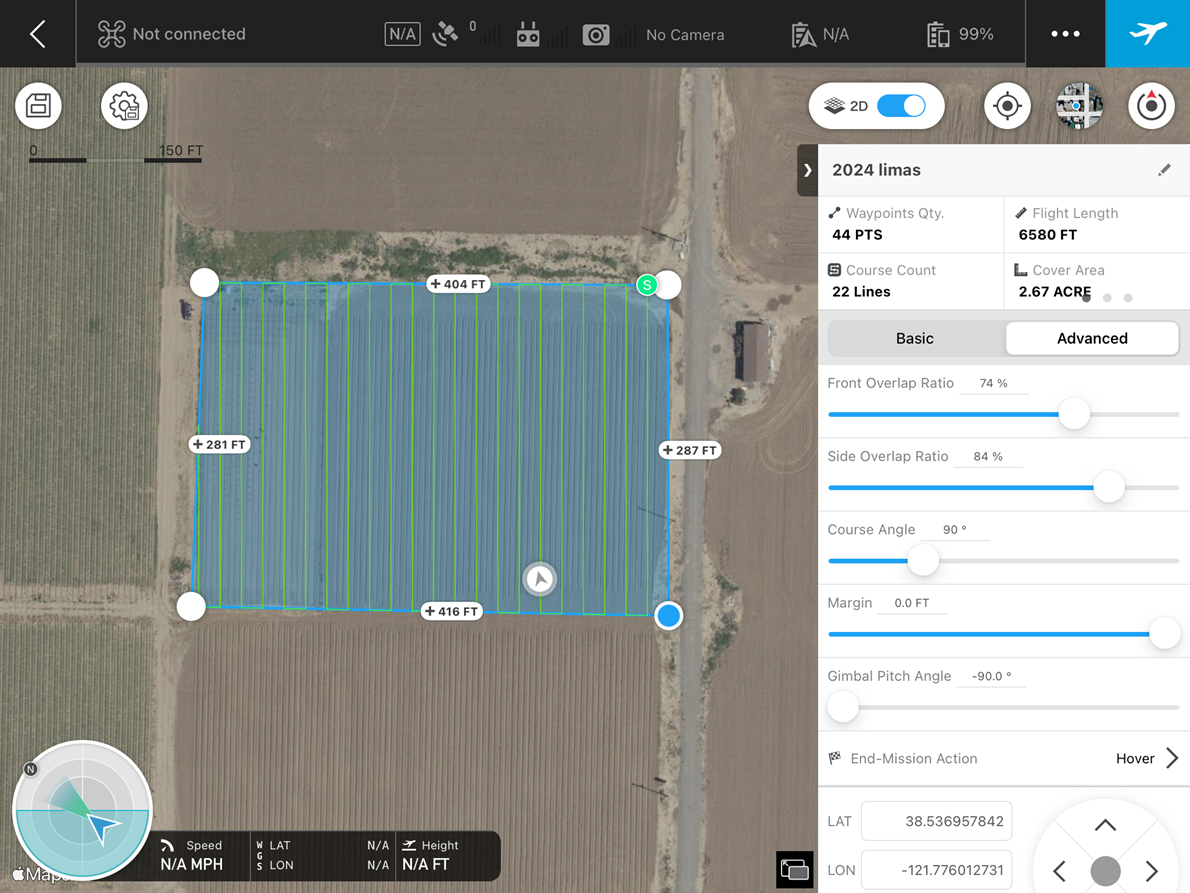
- Set up a flight plan: Many free and easy-to-use mission planning apps are available!
- Fly! Collecting your data is often one of the simpler parts of the pipeline.

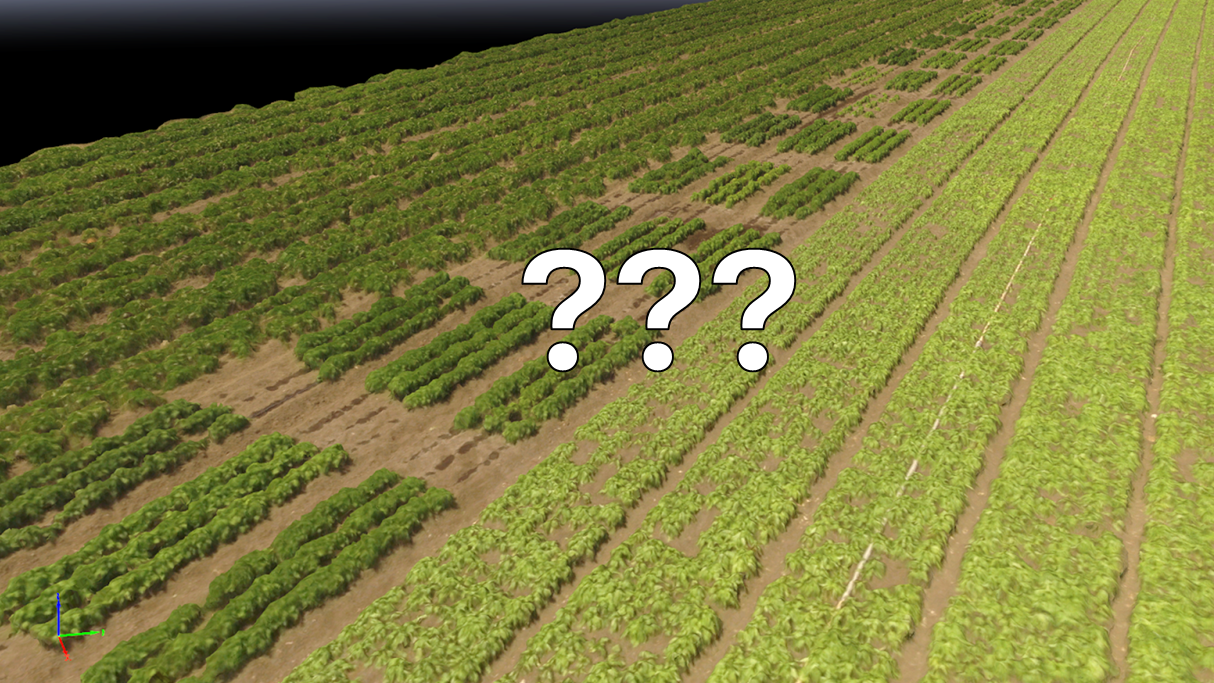
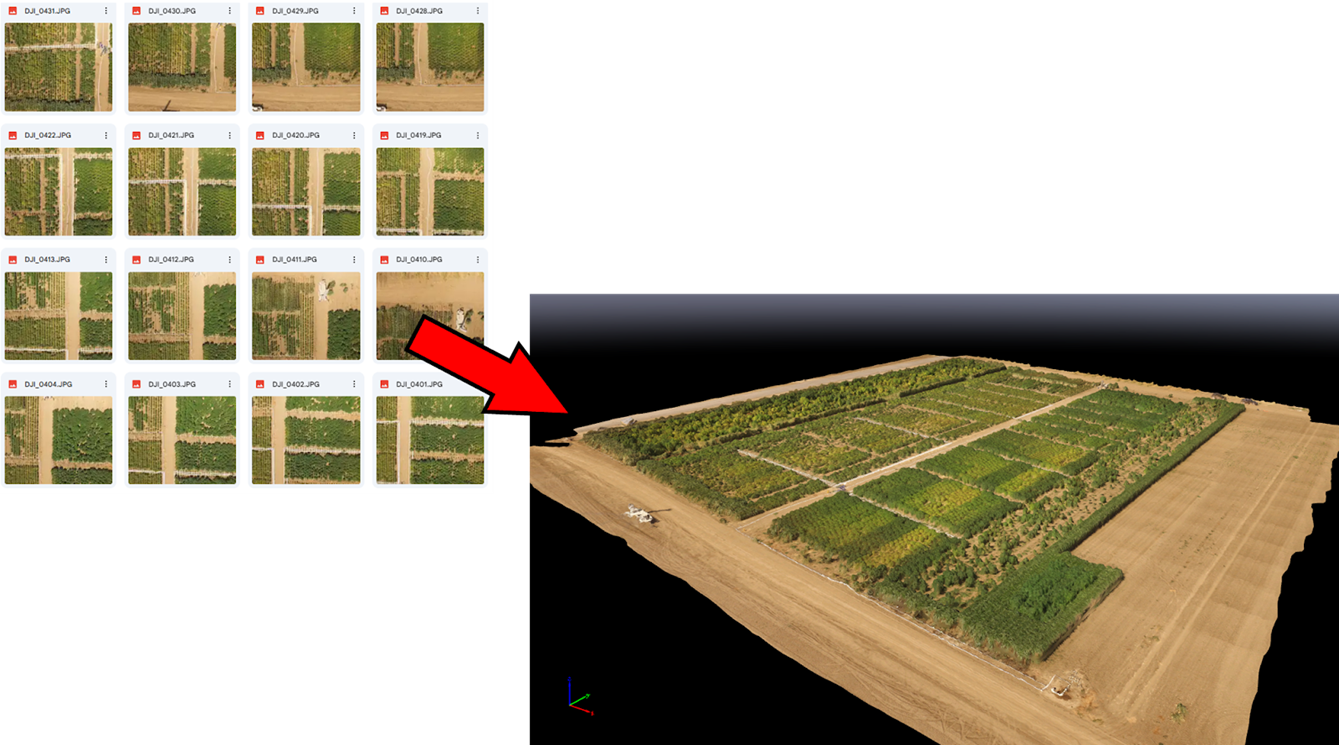
- Process raw images into a 2D and 3D output files of your area of interest using photogrammetry (e.g., in Pix4D)
- Export to GIS software such as QGIS. Particularly helpful QGIS processing functions include:
- The “Georeferencer”: For aligning maps and other files from distinct flight dates or cameras
- “Create Grid”: For delineating plots or other areas of interest
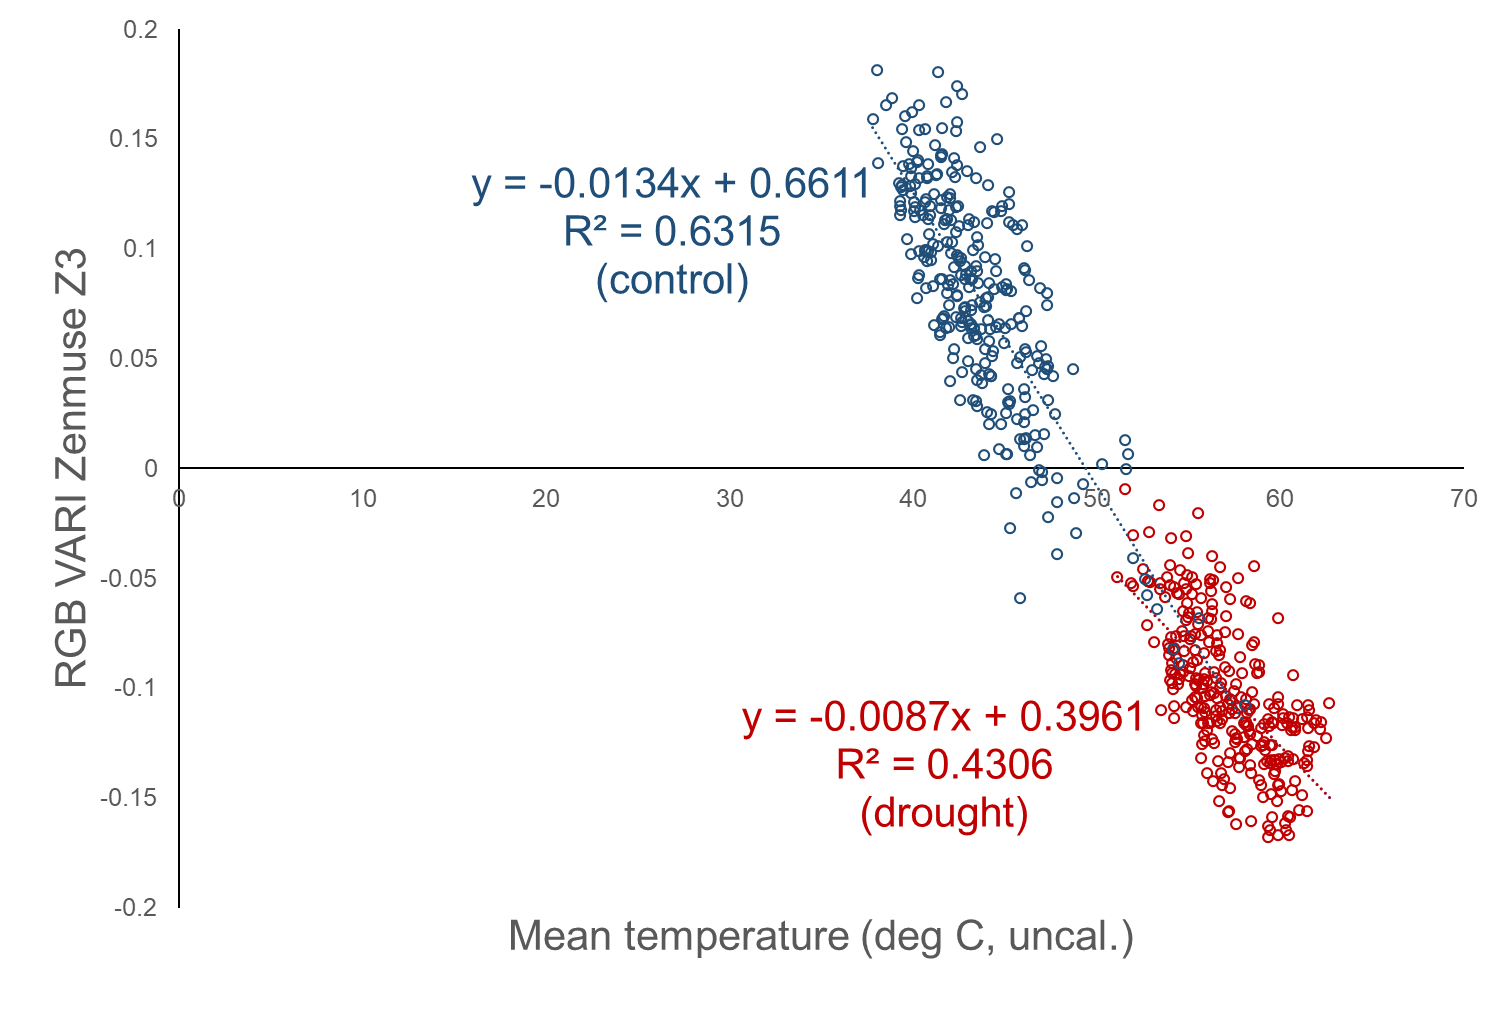
- “Raster Calculator”: For generating vegetation indices, removing soil pixels, and making other helpful comparisons/magic tricks
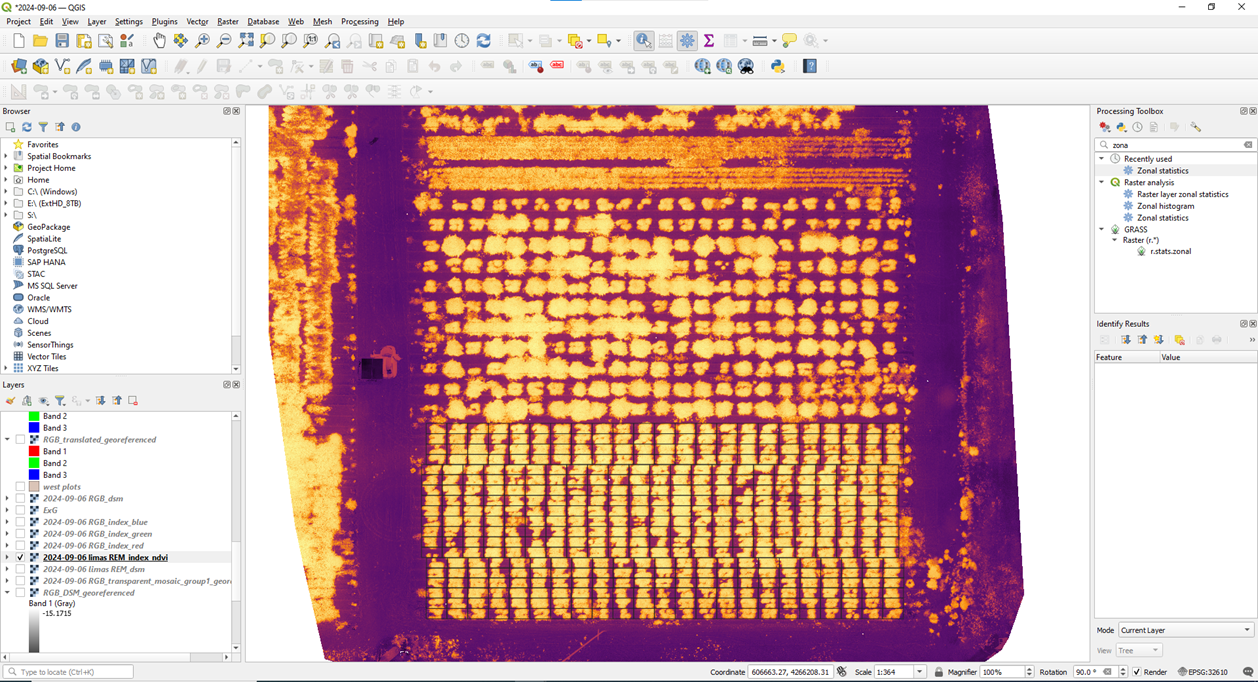
- “Zonal Statistics”: For extracting data to a table
- Process extracted data in R or other software